Standard widgets
Bitmap
Used to display a selected bitmap.
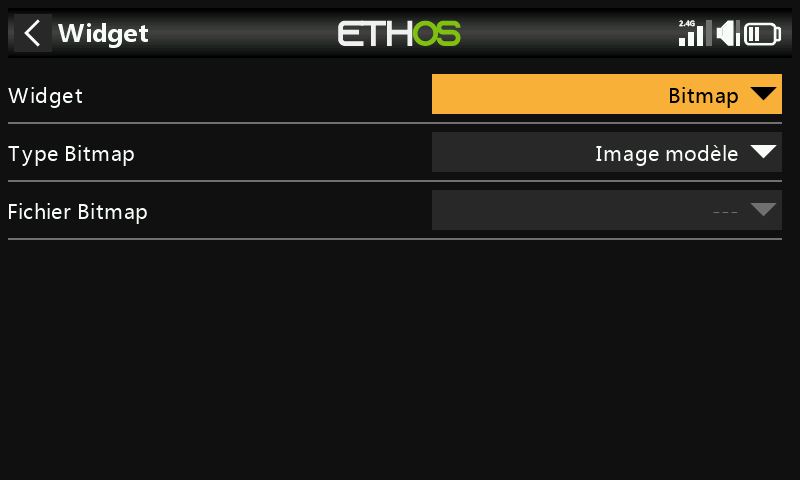
In the example above, the widget will display the model bitmap, which must be located in /bitmaps/model.
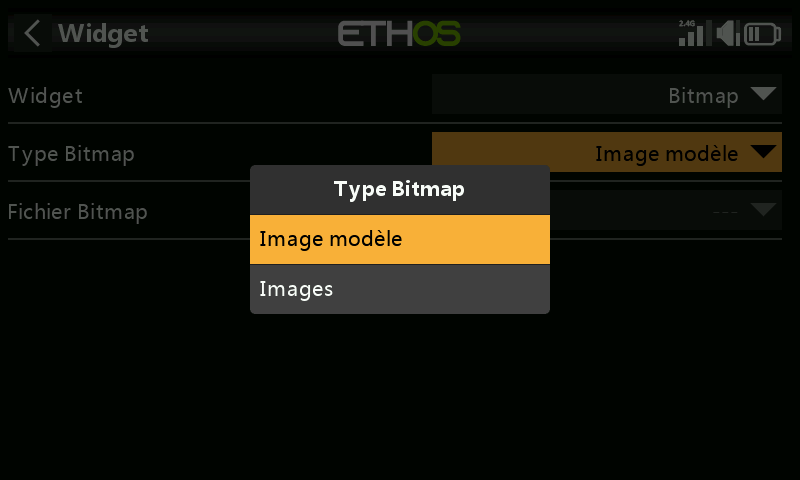
The widget can also display a user bitmap, which must be located in /bitmaps/user.
Value
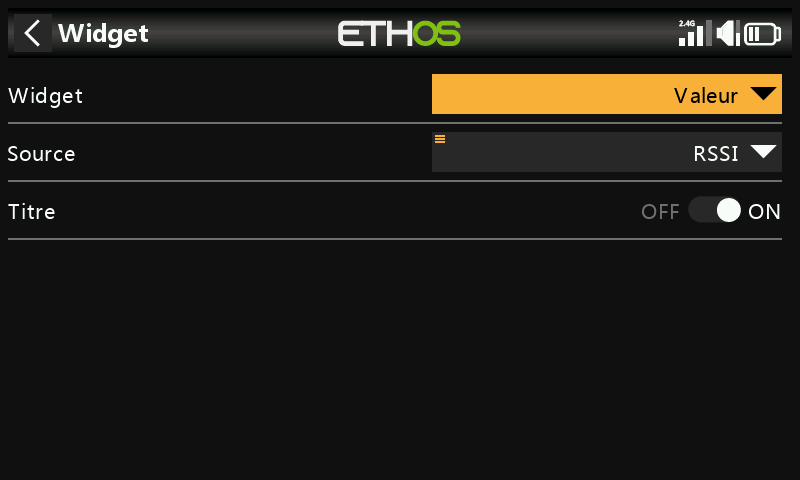
The Value widget simply displays the value of the selected source.
Min/Max value
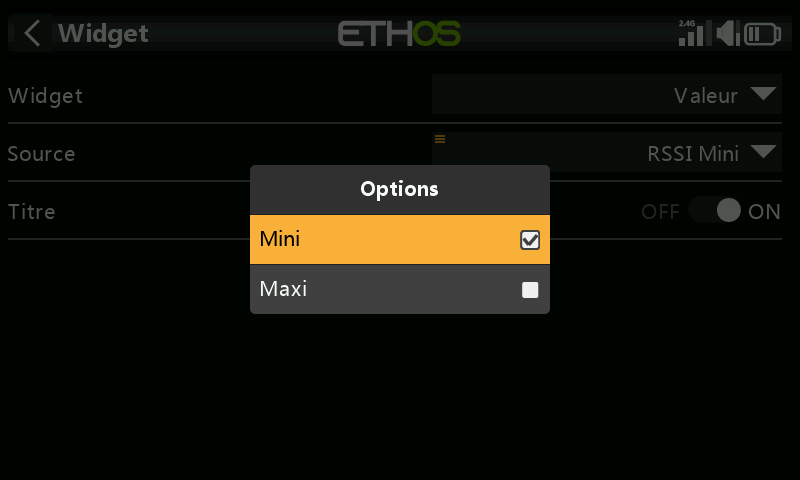
When displaying telemetry values, a long press on the sensor after selection allows you to display the min or max value.
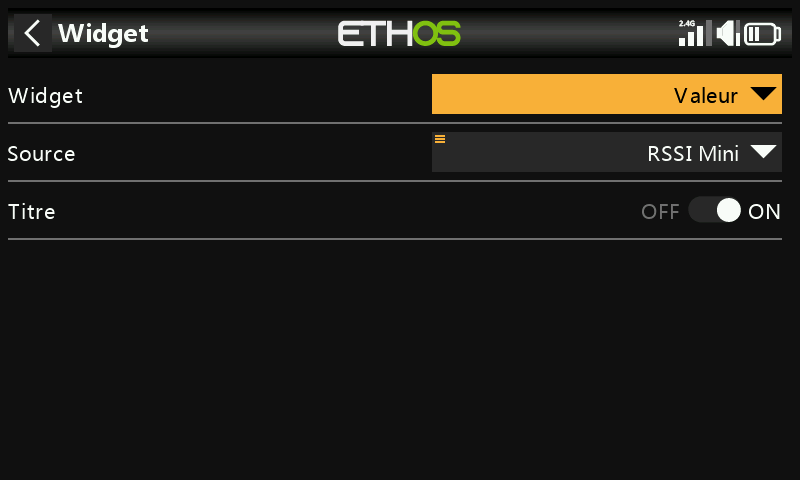
In this example, the minimum value of RSSI will be displayed in the Value widget.
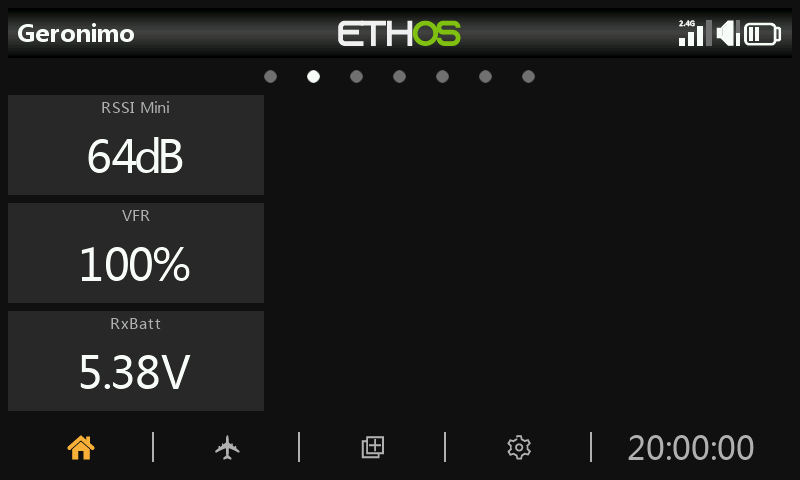
Examples of Value widgets including RSSI Min.
Timer logs
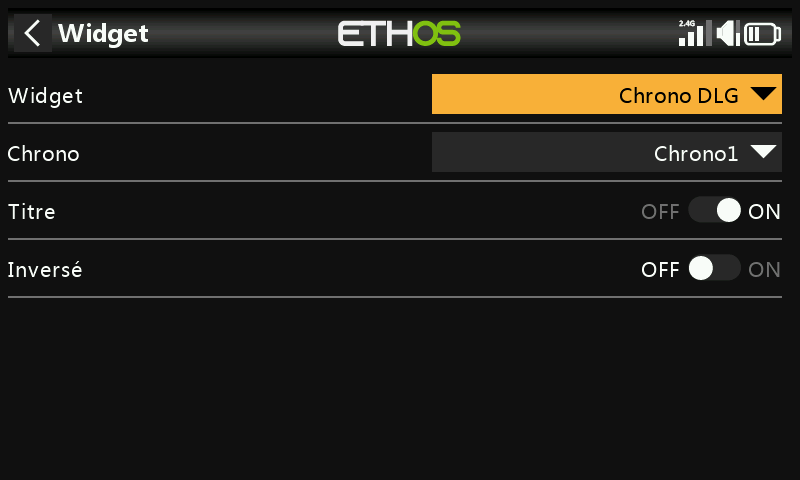
The timer to be logged may be selected. Reverse will put the newest entry at the top of the log.
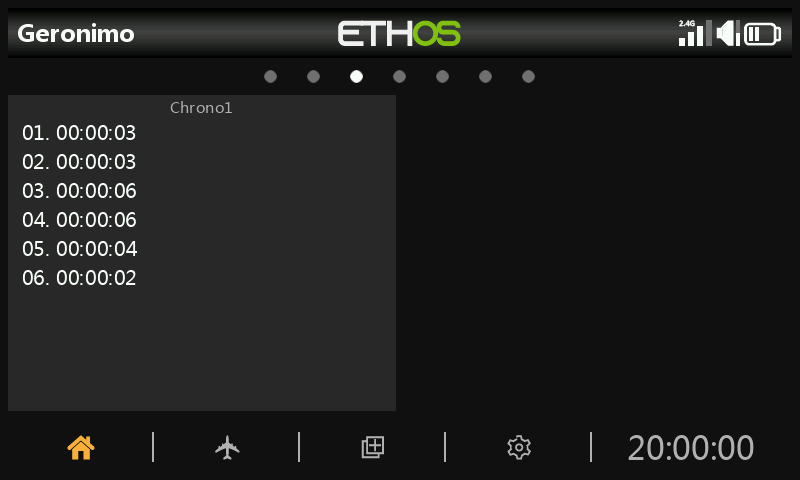
The timer logs provide a log of timer values. The timer values are written when the timer is reset.
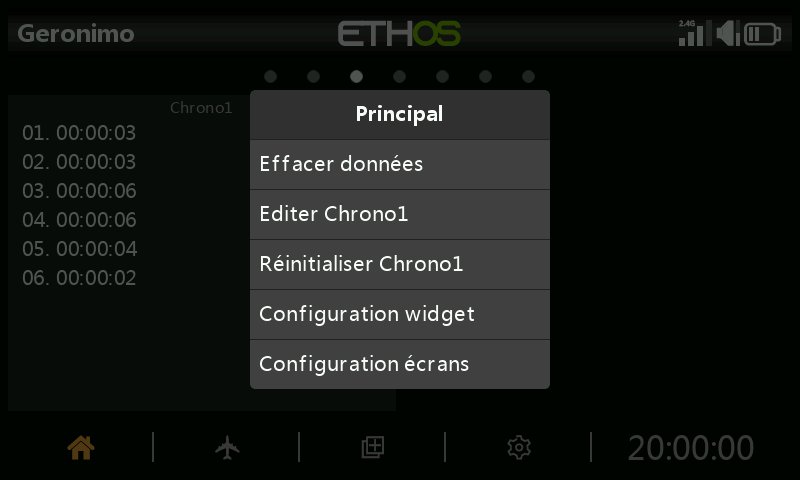
Long press on the widget to ‘Clear logs’, Timer(n) Edit, Timer(n) Reset or configure the widget or screens.
GPS map
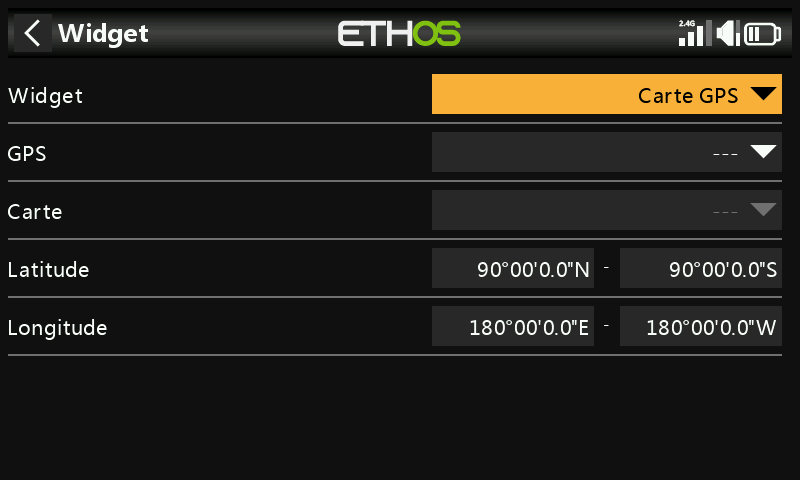
This widget supports a GPS map display. Please refer to the X20 Ethos thread on rcgroups for more details, especially post #8854.
LiPo
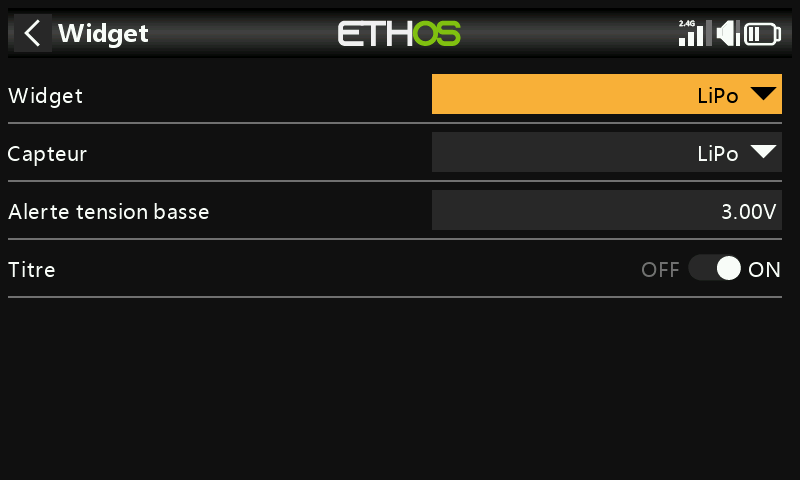
The Lipo widget will display Lipo voltage information from sensors such as FLVSS.
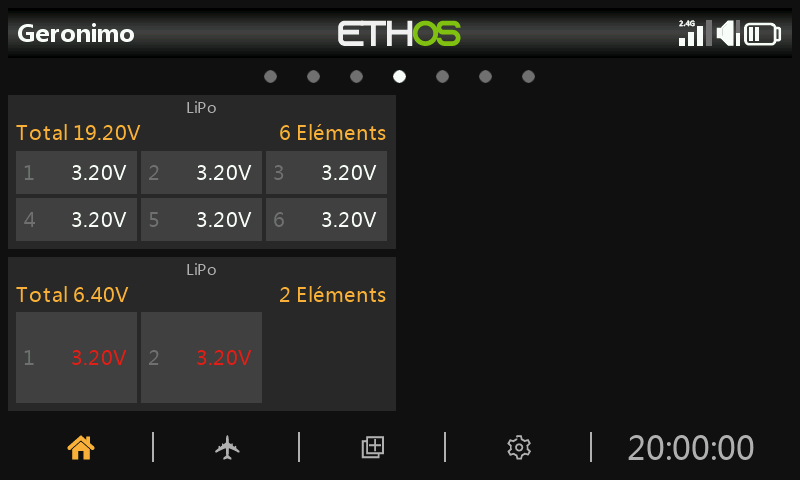
The Lipo widget displays the total pack voltage and the number of cells, as well as the individual cell voltages.
If the lowest cell voltage is below the ‘Low voltage’ threshold, the voltages are displayed in red. In the second Lipo widget above, the low voltage threshold was set to 3.3v causing the value to be displayed in red.
Channels
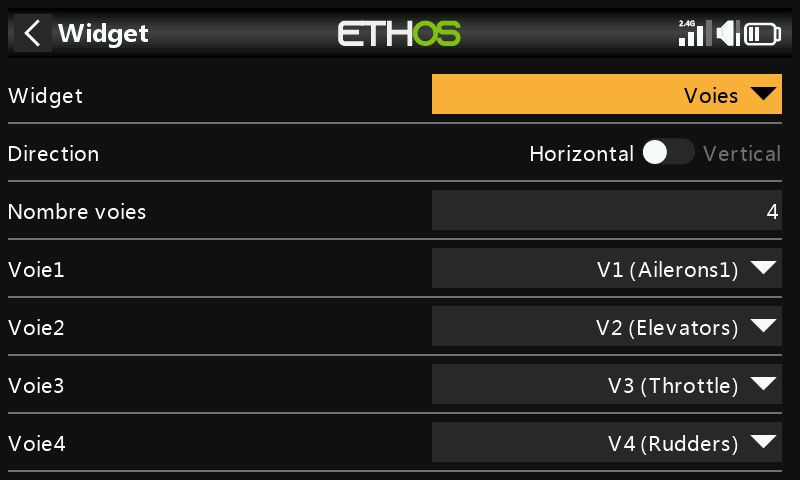
The Channels widget allows up to 8 channels to be displayed in bar chart format, with either horizontal or vertical bars.
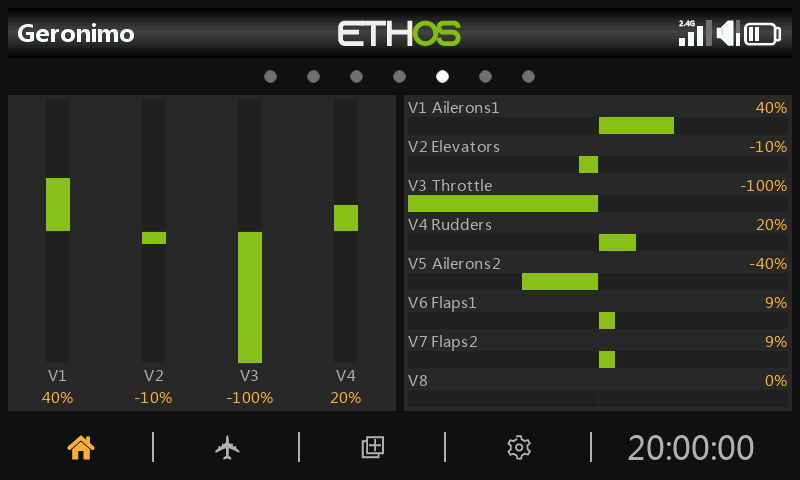
The example above shows two Channels widgets, the left one showing 4 channels vertically, while the right one shows 8 channels horizontally.
Line chart
Configuration
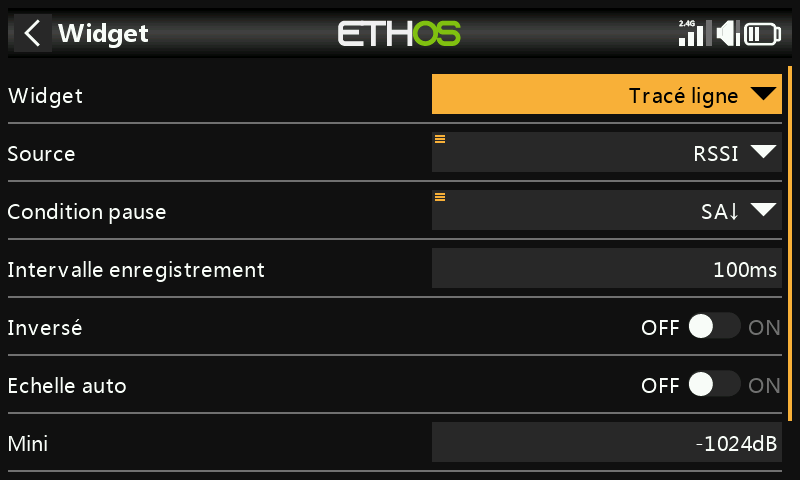
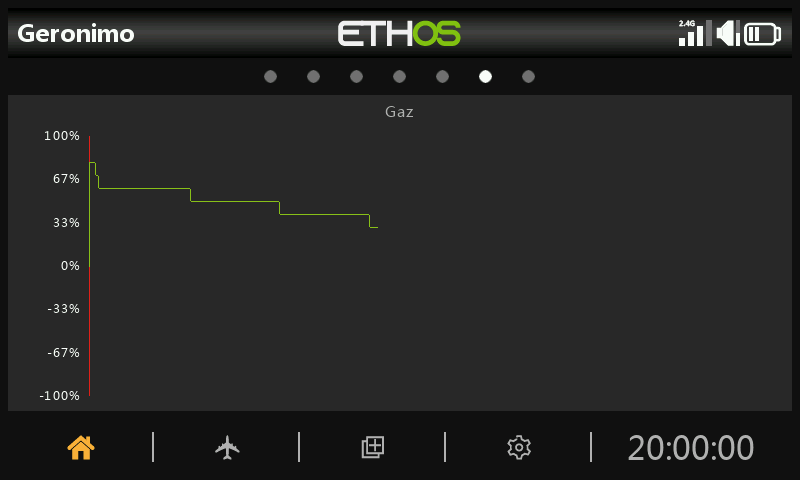
The line chart widget allows the selected source to be charted.
Note that the widget resets its data on a "Flight Reset”.
Source
Select the source to be charted.
Pause condition
Select the source to be used as a pause control. If you do not have any spares, you can also pause and resume the line chart by tapping on the widget while it is running.
Log period
The log period can be set. Using a 500ms period, the chart will cover about 6 minutes before starting to scroll off the page, while 1s will cover about 12 minutes.
Inverted
The log chart can be inverted.
Auto range
If auto range is turned on, then the vertical axis will be scaled to suit the input. If auto range is turned off, then the vertical axis will be scaled according to the Min and Max settings. In the example above, the top widget has been set for auto range and the chart shows a source swing of +26% to -22% so far.
Min/Max
In the example above, the bottom widget has auto range turned off, and a fixed range of -100% to +100% is in use.
Run-time options
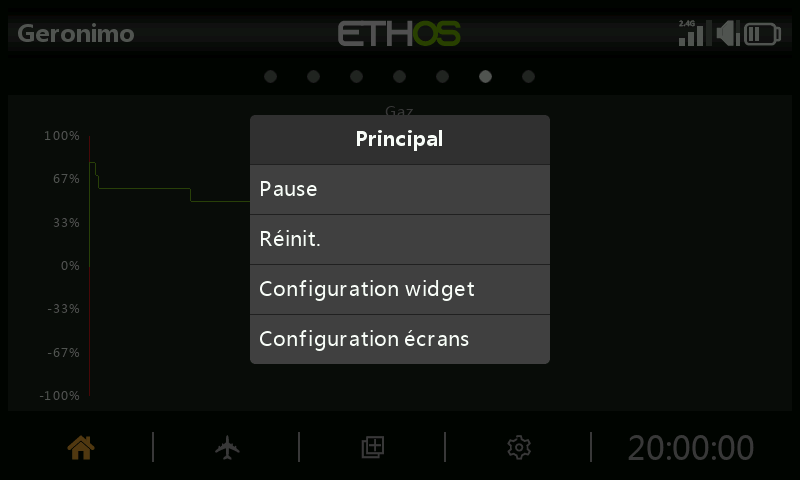
Tapping on the line chart while it’s running brings up a dialog which allows you to:
- Pause or resume logging
- Reset the chart and start again
- Configure the widget settings
- Go to the ‘Configure screens’ menu
Text
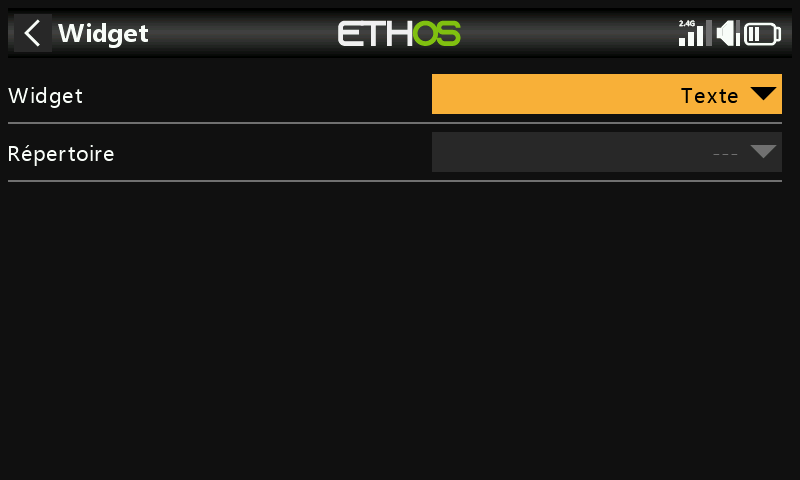
The text widget will display the contents of a text file. The markdown format is supported.
The text file should be placed in a folder named documents/user.
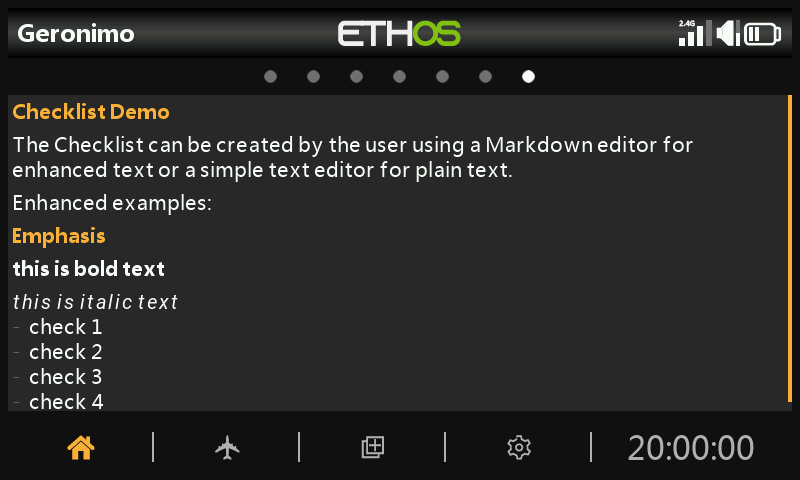
The contents of the file will be displayed in the Text widget.